

Forex tick charts and why you shouldn’t use them
Содержание статьи:
If you have been trading Forex for a while, you may have come across tick charts.
On the internet, these charts are usually accompanied by eloquent explanations of why they are so much better than traditional candlestick charts.
But this is not the case. At least for spot traders.
We want to tell you why you shouldn’t use them and show that they do not contain accurate information.
We’ll get into the details in a minute, but first let’s take a step back and look at what tick charts are.
Forex tick charts
A tick in the context of Forex charts is a change in the price of a currency pair caused by a single trade.
Thus, unlike charts with time intervals, for example, five-minute or four-hour charts, a new candle is printed on tick charts after several trades.
The number of trades can be easily changed, so you can get tick charts that print a candlestick after 144, 233, or 333 trades.
Or any other arbitrary number of deals that you deem most appropriate.
Tick charts have several advantages
- They show the momentum and strength of the market much better than time-based candlesticks. For example, if a range breakout is observed, chances are that you will be able to find the entry point much earlier on tick charts, as the candles will follow each other much faster. This allows large movements to be anticipated.
- If you are trading with a trend, waves in the direction of the trend tend to be more active than waves in the direction of the trend. This creates a more pronounced trend structure that is much easier to trade.
- On tick charts, periods of low activity are compressed . If the trading intensity is low, new candles take a long time to form, so the charts look cleaner.
Let’s see it in action using EUR / USD futures. The chart on the left is 233 ticks, and on the right is the 5 minute timeframe of the time chart.
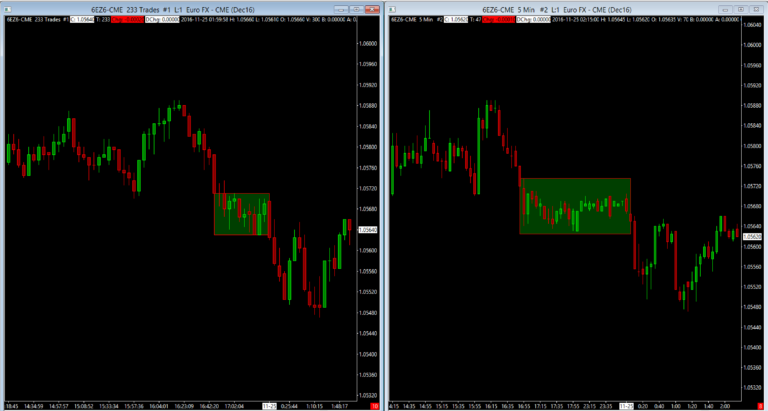
If activity is low, the tick chart will display fewer candles than the timed one, which often results in a cleaner trend and better understanding of price action. Sounds good, doesn’t it?
Why you shouldn’t use them
Sounds really great! And tick charts can be a pretty valuable asset in a trader’s toolbox, and we have no complaints about them.
The problem is with Forex tick charts and data that goes into one tick.
Forex data
To do this, we need to take a step back. Where do brokers get their data from?
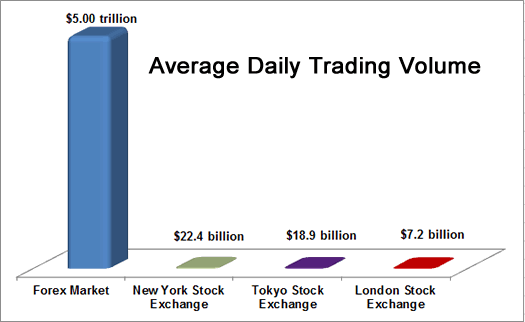
The Forex market is huge! With a daily trading volume of over $ 5 trillion – other markets seem tiny by comparison!
But you only get access to a small portion of that volume.
Forex brokers usually get their data from one or more liquidity providers (or create their own liquidity by acting as a market maker).
Liquidity providers can be large institutional banks, financial institutions and ECNs.
Companies like LMAX and Integral specialize in providing the necessary liquidity to your broker.
Forex tick charts are imprecise.
Data Accuracy
In a sense, the prices you get from your broker come from this liquidity network.
Forex does not have a central exchange like stocks or futures, and each broker has their own piece of the overall pie (with liquidity providers as intermediaries).
Orders placed by clients of this broker, together with orders from the liquidity network, form all the trades and volumes that you see in your trading platform.
This is not an accurate picture of the Forex market.
You see, when you trade futures, each market participant must submit their order on a specific futures exchange (CME, NYMEX, and so on).
The volume and tick data that you receive will be 100% accurate information about the current market participants.
Whether you are a top trader from an institutional bank or a retail trader who is just trying your hand, you are all in one bundle.
When you trade Forex, orders are placed with your broker and not on a centralized exchange. If your broker takes the other side, they won’t even inform their liquidity partners about it.
Therefore, all tick data and volume data are only an idea of the activity of this particular broker.
This is also the reason why charts may not look exactly the same for different brokers. This is a consequence of the decentralized nature of the Forex market.
There will, of course, be some correlation between your broker’s tick data and general market data.
The same goes for the correlation between your broker’s volume and the overall market volume. Caspar Marney, a former UBS and HSBC trader, has calculated that the correlation will be over 90%.
While there may be some truth to this, it is highly dependent on the broker you use.
And we still wouldn’t rely on data that might be valid (but might also be invalid).
What to do
Although tick data in Forex is unreliable and inaccurate, there are several ways to get around it:
Currency futures

One option is to trade currency futures.
Most currency futures are traded on the Chicago Mercantile Exchange (CME), one of the largest futures exchanges in the world.
By trading futures, you will have an accurate understanding of the market participants and the transaction volumes of other traders.
Tick charts will represent the actual number of transactions, and the volume data will represent the actual volume of currency futures.
Using ECN / high liquidity brokers
Given all we know about the unreliability of tick and volume data in Forex, the best we can do is use brokers that are either part of an electronic communications network (ECN) or have multiple liquidity providers.
After all, the larger your broker’s liquidity network, the more accurate the presentation of tick data and volume information will be.
They will not match up with the global Forex market data, but at least they will be a relatively accurate, scaled-down representation of the entire market.
However, you can still use tick data to get an idea of market activity.
Not perfect, but sometimes the approximate parameters are very useful. Pepperstone (our current broker) is an ECN broker that aggregates liquidity from twenty-two major banks and ECNs.
As a result, it provides a more accurate view of the Forex market than many other brokers.
Using historical aggregated tick data
Companies like TickData trade historical tick data. The tick data stream is aggregated from over 95 different sources.
This data is perhaps the closest you would get if you had a stream of information from all over the Forex market.
Keep in mind that it is quite expensive to subscribe to some of the tick data companies.
In addition, this data is not provided in real time, so it is less useful in day-to-day trading.
What do you think about tick data and volume information in Forex? Do you use tick data to trade Forex? Let us know in the comments!