

Many traders and investors are wondering if the price decline in the market is long-term or is it just a small correction.
In such a situation, some people sell the stock and then watch out of the market as it resumes growth in a couple of days.
This is a fairly common scenario.
In general, such situations cannot be avoided, however, if a trader knows how to determine corrective movements and what actions to take, he can improve his work efficiency.
Corrections and reversals
Содержание статьи:
Corrections are temporary price reversals that occur within larger trends.
It is important to understand here that during a correction, a price reversal is a temporary phenomenon and does not mean that the trend will change.
On the other hand, a reversal is a change in the direction of the trend , meaning that the price can continue to move in the direction of the reversal for a certain amount of time.
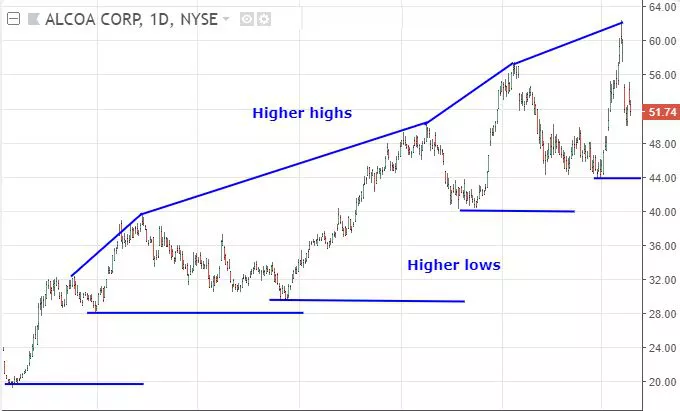
It is important to understand that with corrections, an uptrend is clearly visible on the chart. The share price is going up.
At this time, new highs appear. Then the price falls and resumes growth even before it touches the previous lows.
This is one of the hallmarks of an uptrend – higher highs and higher lows. When this happens, it can be argued that the trend is up.
However, when a lower low or high appears, the trader already has a question about the uptrend. It is quite possible that a reversal is forming in the market.
The importance of identifying corrections
It is important to be able to distinguish corrections in the market and highlight them so as not to be confused with reversals. There are several key differences that are important to take into account when classifying price movements:
|
Factor
|
Correction
|
Reversal
|
|
Volume
|
Retail traders take profits (small volumes)
|
Institutional players sell (large volumes)
|
|
Cash flow
|
High interest in purchases during the decline
|
Little interest in shopping
|
|
Chart patterns
|
Few reversal patterns, sometimes just a couple of candles
|
Multiple reversal patterns, chart setups like double top often appear
|
|
Interest in sales
|
Small
|
Growing interest in short positions
|
|
Timeframe
|
Short-term reversals usually last one to two weeks
|
Long-term reversals can last longer than two weeks
|
|
Fundamental reasons
|
No change in fundamental background
|
Changes in the fundamental background
|
|
Recent Activity
|
Corrections usually occur after major rallies.
|
May appear in any market condition
|
|
Candles
|
Usually accompanied by candles of uncertainty with long shadows, such as spinning tops
|
Reversal candles, include engulfing, soldier and other similar patterns
|
It is important to remember that interest in short positions is a lagging indicator and it is difficult to say how high this interest is, it all depends on the timeframe.
Summarizing below the table above, we can say that corrections have a lot of signs of uncertainty, while reversals have clear signs.
Volumes can be small during corrections, and spikes appear during reversals.
Uptrend corrections are characterized by higher lows and higher highs, while reversals are often defined by patterns such as double top, where tops and lows are on the same level, or head and shoulders, where both highs and lows decline.
Short-term corrective moves look ” hesitant ” while reversals show longer candles and impulses.
So why is it important to be able to define. When the price begins to correct, investors and traders are faced with a choice.
They need to make one of three decisions
- Continue to hold the asset during sales, which can lead to large losses if the correction turns into a reversal of the entire trend.
- Sell and buy when the price recovers. But in this case, the trader will lose on commissions and spreads. It can also lead to lost profits if the price rebounds sharply.
- Sell. In this case, the trader may face a lost profit situation if the price recovers.
By correctly identifying the market situation, be it a reversal or a correction, a trader can cut costs, limit losses and keep profits.
Methods for defining corrections
There are several interesting tools that allow you to identify market corrections.
- Fibonacci extensions.
- Pivot points ( support and resistance levels ).
- Trend lines (support and resistance levels).
Fibonacci
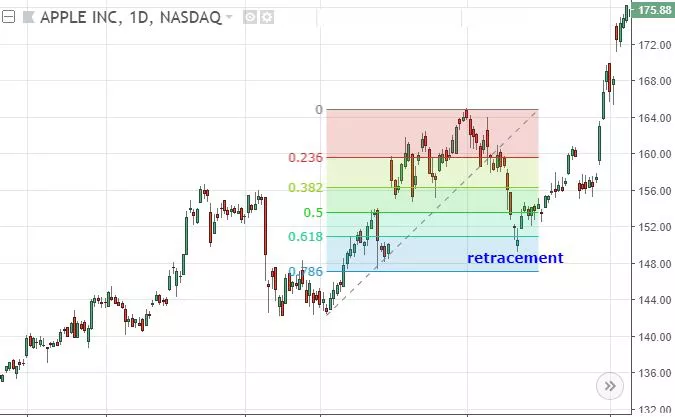
This tool provides an excellent opportunity for calculating offsets. It is available in most charts.
To use it, you need to draw a line from the top of the price to the minimum values in the last price impulse.
Extensions between 23% and 78% are prime. This does not mean that the stock falls 23% every time. This means if the stock price has changed from $ 10 to $ 15, most likely the correction from this movement will be 23%.
A correction from $ 15 to $ 13.85 or even up to $ 11 is possible. At the same time, the upward trend remains, as $ 15 is a new high, and $ 10 is a recent low.
If the price reverses up above $ 10, then the uptrend continues. Here we can assume that the price will continue to rise and reach new highs.
If the price fails to overcome $ 15 and reverses down again, it may be time to close positions.
An upward trend can be seen in the screenshot. As part of the correction, the price falls below 61.8% before reaching new highs.
Pivot points
Pivot reversal levels are also often used in identifying corrections.
The price often reverses near pivot points and resistance levels, and if the upward movement then continues, it means that there is a strong trend in the market.
If the price stops and reverses, then the trend is stopped. Pivot points are often used by traders.
For this, the prices of the previous day are used to identify support and resistance levels for the next day.
Support for trend lines
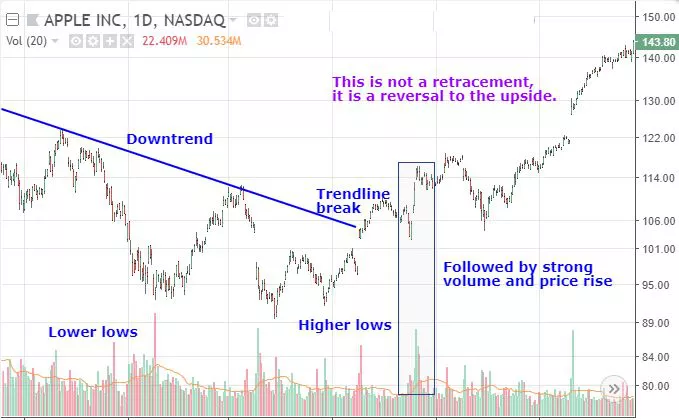
Finally, if the price breaks the trendline on high volume, it is most likely a reversal on the chart. Chart and candlestick patterns are often used near trending trends to confirm reversals.
The chart below shows such a situation. Here you can see the downtrend, but then the price rises and breaks the trend.
At this point, the price sets a new local maximum.
Then, after the breakout, there is a slight correction, however, it ends quickly and the uptrend resumes at higher volumes.
Accordingly, this can no longer be considered a correction to the downtrend. Rather, here we are talking about a full-fledged reversal, and the trend changed to an upward one.
Dealing with false signals
Sometimes, even if there are all signs of a correction, the price may start to reverse. The best way to protect yourself from this is by using stop losses .
Here’s how to do it
- Determine retracement levels using technical analysis and set stop losses below these levels.
- Stop losses can also be placed below the long-term trend or moving average .
Ideally, every trader wants to reduce risks during corrections and exit the market if a full reversal begins.
Practice and understanding that it will not work out every time on time is important here.
Sometimes what looks like a reversal ends up as a retracement and vice versa, what looks like a reversal ends in a full reversal.
Even so, it is important to understand the difference between a correction and a reversal in order to trade effectively.
conclusions
It is important to be able to distinguish corrections from reversals. Without this knowledge, the trader runs the risk of exiting the market too early and losing opportunities.
At the same time, inexperienced traders hold unprofitable positions for too long, which can lead to even greater losses.
By combining technical analysis and knowledge of how to distinguish a correction from a reversal, an investor can hedge against risks.