

Using pivot points for forecasting
Содержание статьи:
Pivot points were originally invented by traders on the stock and commodity exchanges.
They are calculated based on the high, low and close prices of previous trading sessions and are used by traders to predict support and resistance levels in the current or upcoming session.
These support and resistance levels can be used by traders to determine entry and exit points for both stop losses and profit taking .
Pivots are a great way to spot areas of support and resistance, but they work especially well when combined with other types of technical analysis. Keep reading the articles on our site for a comprehensive overview of both technical analysis patterns and indicators, and how they can be used to make informed forecasts and manage risk.
How to calculate pivot points
There are several different methods for determining pivot points, the most common of which is the five-point system.
This system uses the previous day’s high, low, and close, as well as two support and two resistance levels (for a total of five price points) to determine pivot points.
The equations look like this:
Pivot Point (P) = (Previous High + Previous Low + Previous Close) / 3.
Support 1 (S1) = (pivot x 2) – previous high.
Support 2 (S2) = pivot point – (previous high – previous low).
Resistance 1 (R1) = (pivot x 2) – previous low.
Resistance 2 (R2) = pivot point + (previous high – previous low).
For stocks that only trade during certain hours of the day, the high, low and standard business hours close should be used.
In 24-hour markets such as Forex , pivots are often calculated using the New York City close (4:00 pm EST) on a 24-hour cycle.
Since Greenwich Mean Time is also often used in Forex trading, some traders prefer to use 23:59 GMT to close a trading session and 00:00 GMT to open a new session.
Pivot points on a chart are usually calculated based on the previous day’s data, allowing you to find support and resistance levels for the next day.
However, you can also use the data from the previous week and calculate the pivot points for the next week. This will be useful for swing traders and, to a lesser extent, day traders.
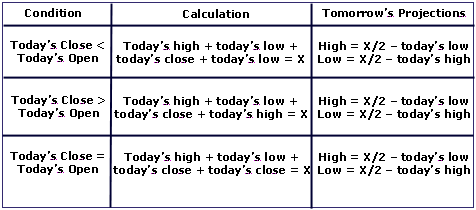
Another common variation of the five-point system is to include the opening price in the formula:
P = ((today’s O) + yesterday’s (H + L + C)) / 4.
In this case, the opening price ” O ” is added to the equation .
Support and resistance levels are calculated in the same way as in the five-point system, except that a different pivot point is used.
Another system for determining pivot points was developed by Tom DeMark, President of Market Studies, Inc. This system uses the following rules:
As you can see, there are many different systems for finding pivot points.
While knowing how to find pivot points is essential to understanding what you are using, most charting and analysis platforms calculate them automatically.
You just need to add the pivot-points indicator to the chart and select the settings you want.
Interpreting and Using Pivot Points
When calculating pivot points, one should take into account that the pivot point itself is the main support / resistance level.
This means that the largest price movement will approximately occur when this price is reached.
Other support and resistance levels are not as powerful but can generate significant price movements as well.
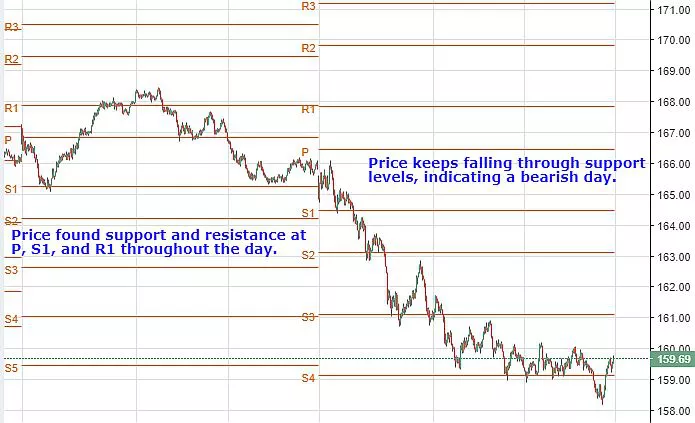
Pivots can be used in two ways. The first way is to determine the general market trend .
If the price of the pivot point is broken by the upward movement, then the market is bullish. If the price falls through the pivot point, the market is bearish.
The second method is to use pivot-based price levels to enter and exit the markets.
For example, a trader can place a limit order to buy 100 shares if the price breaks the resistance level.
Alternatively, the trader can set a stop loss at or near support.
While at times these levels are very good at predicting price movements, there are also times when they have no effect at all.
As with any technical instrument, profit can hardly be obtained by using only one indicator.
Outcome
Pivot points are a useful tool that will not be redundant in any trader’s toolbox.
This allows anyone to quickly calculate the levels that could trigger important price movements.
However, the success of the system rests directly on the trader’s shoulders and depends on his ability to effectively use pivot points in conjunction with other forms of technical analysis.
Technical indicators can be anything from MACD to candlestick patterns , as well as moving averages to help establish the direction of the trend.
The greater the number of positive signals for a trade, the greater the chances of success.